Examples of our study results
 |
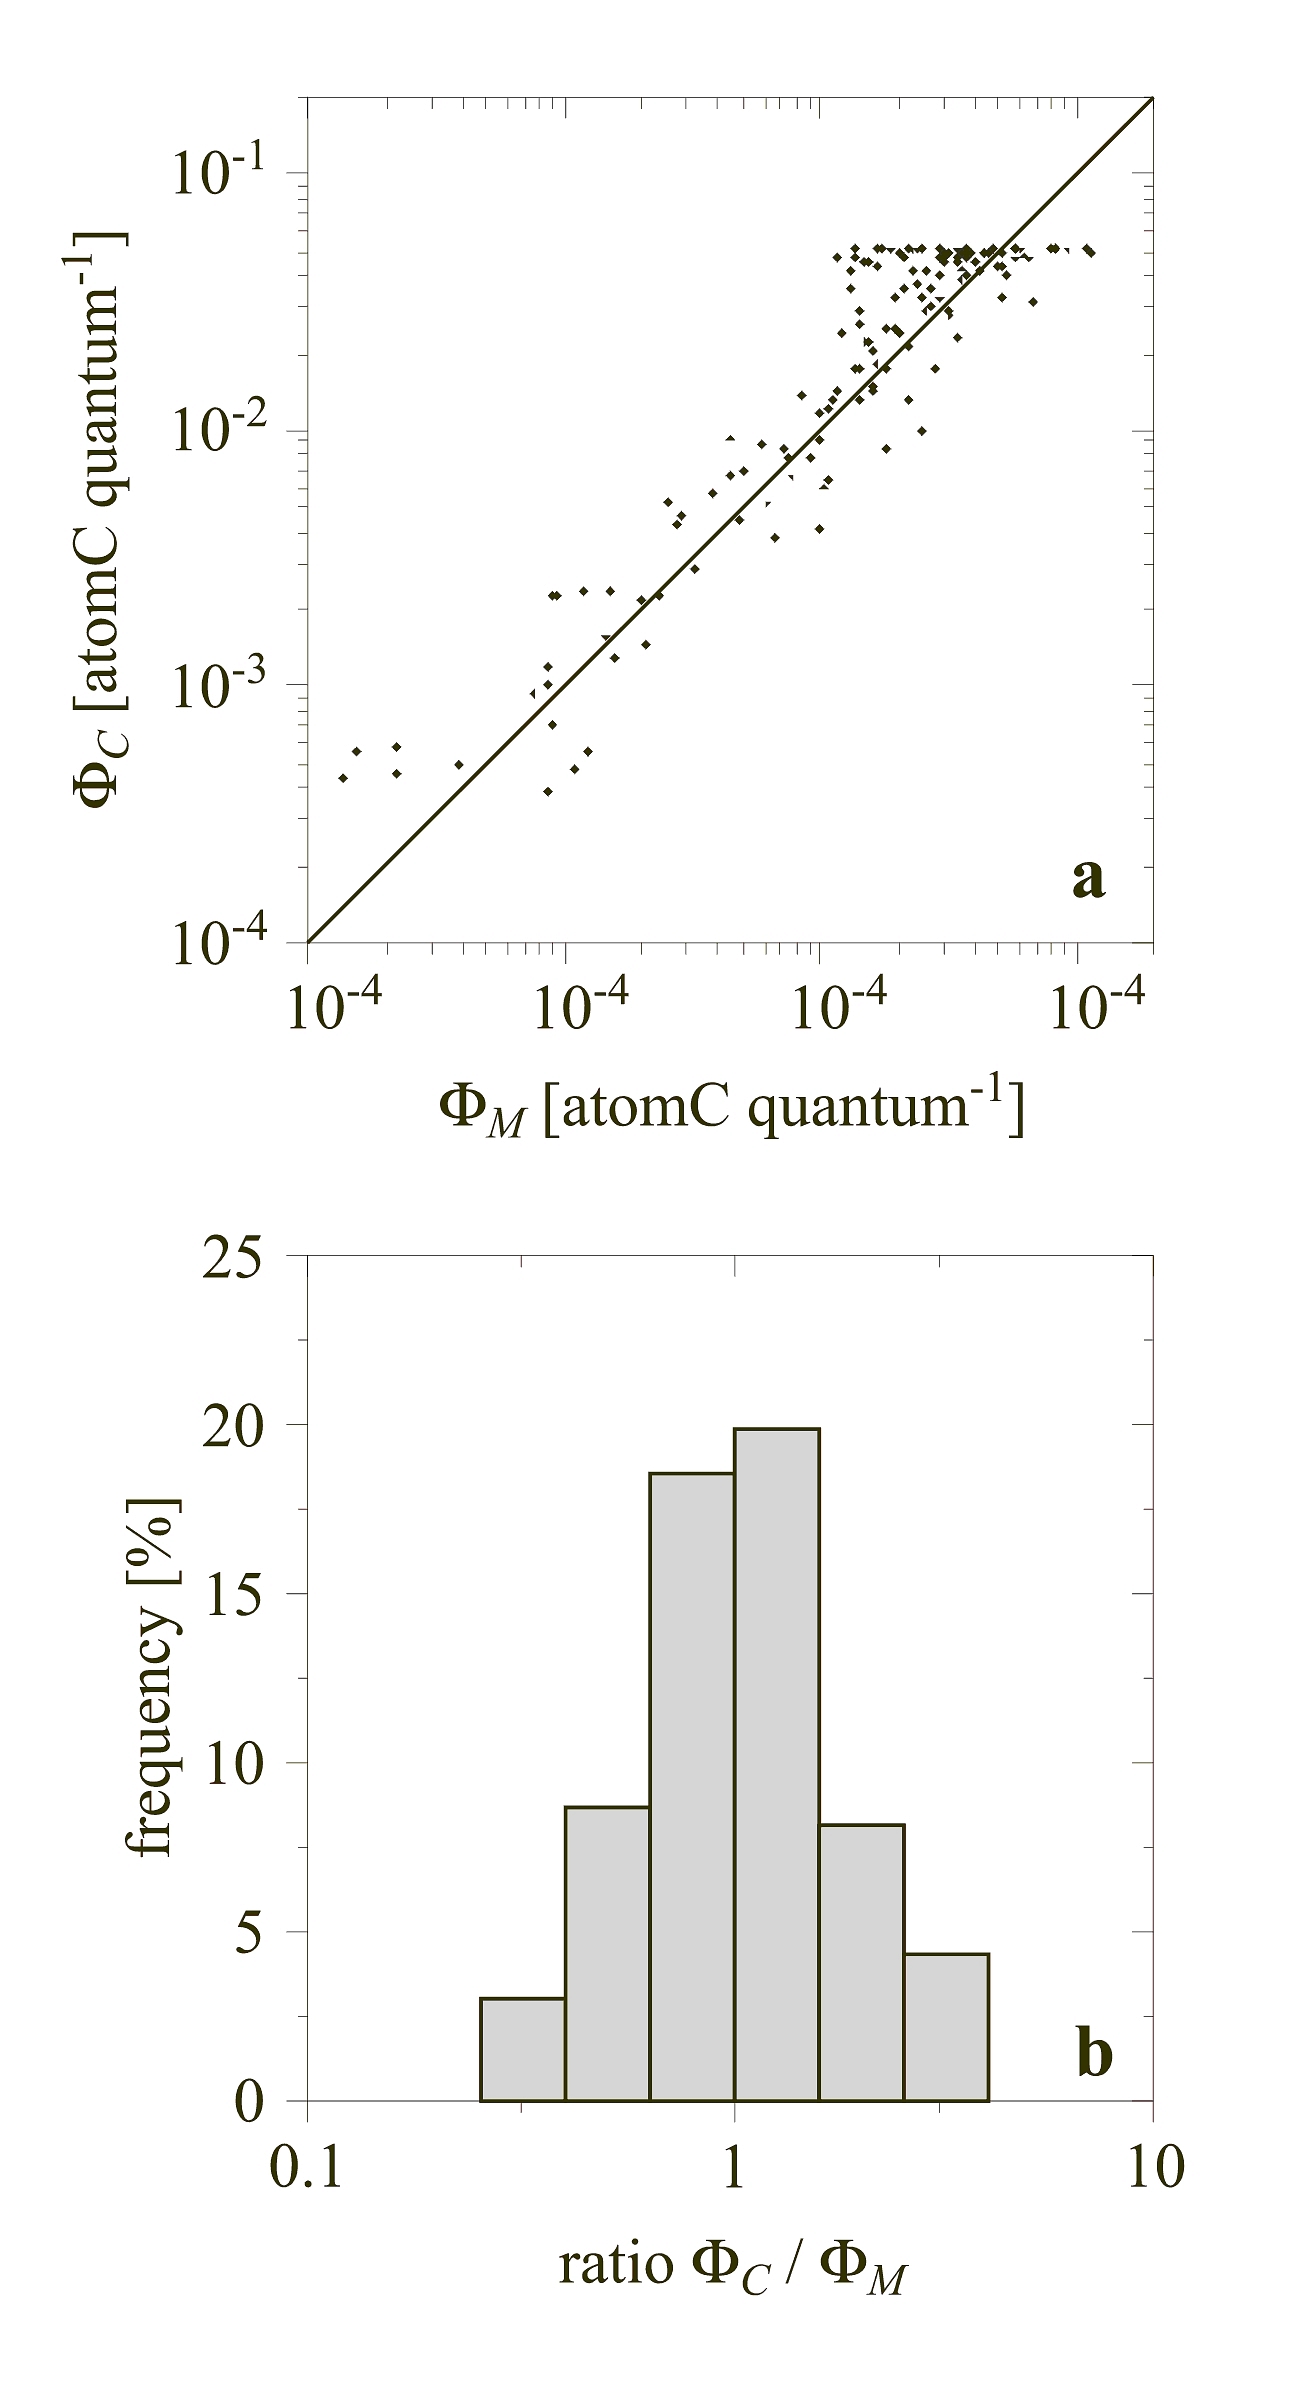 |
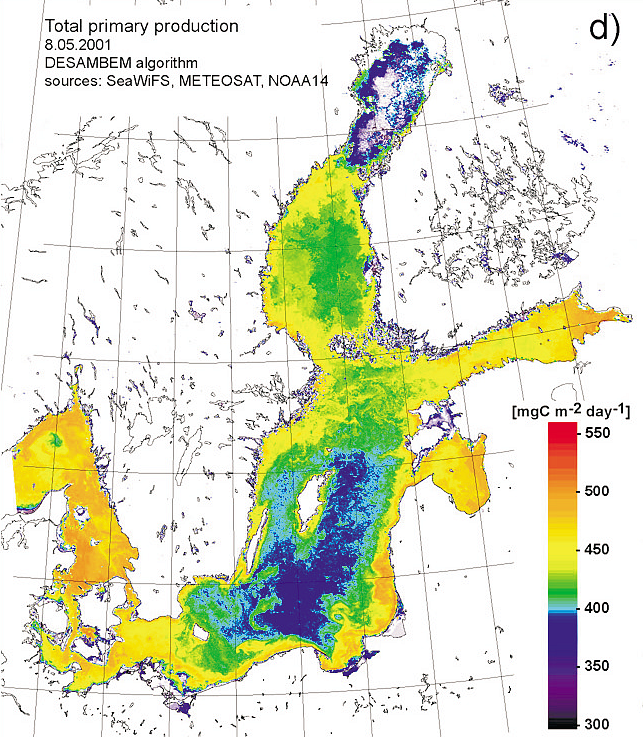
| Example of the remotely sensed distribution of total primary production Ptot for the whole Baltic (from Darecki et al. 2008) | Quantum yield of photosynthesis Φ in the Baltic at different stations and at various depths in the sea: comparison of measured ΦM and calculated ΦC according to the model of the yield (from Woźniak et al.. 2007; eq. 4 and Table 1) (a); histogram of the ratio ΦC/ΦM (b) |
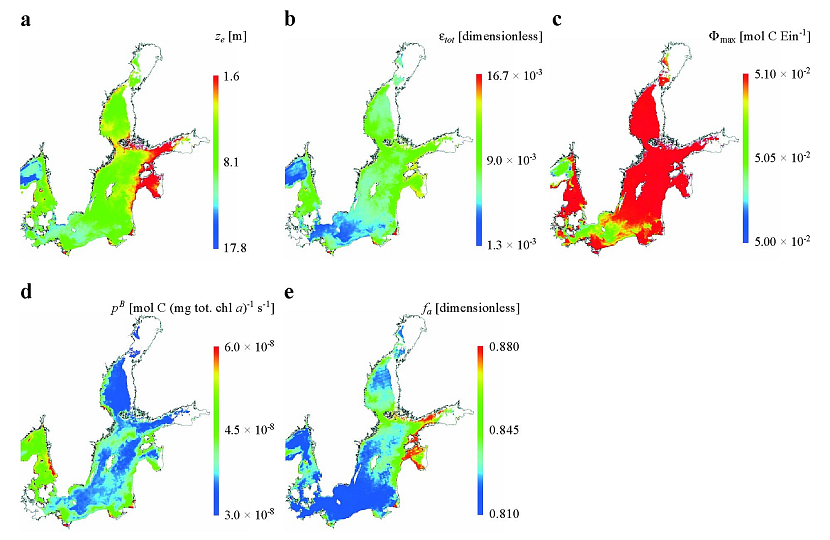 |
| Example maps of remotely sensed distributions in the Baltic Sea at 11:00 UTC on 24 April 2011: (a) the depth of the euphotic zone ze; (b) the photosynthetic index εtot; (c) the maximum quantum yield of carbon fixation Φmax; (d) the phytoplankton assimilation number PB (e) the non-photosynthetic pigment factor fa (From Woźniak et al., 2011; see more in: OCEANOLOGIA 53(4)/2011. |
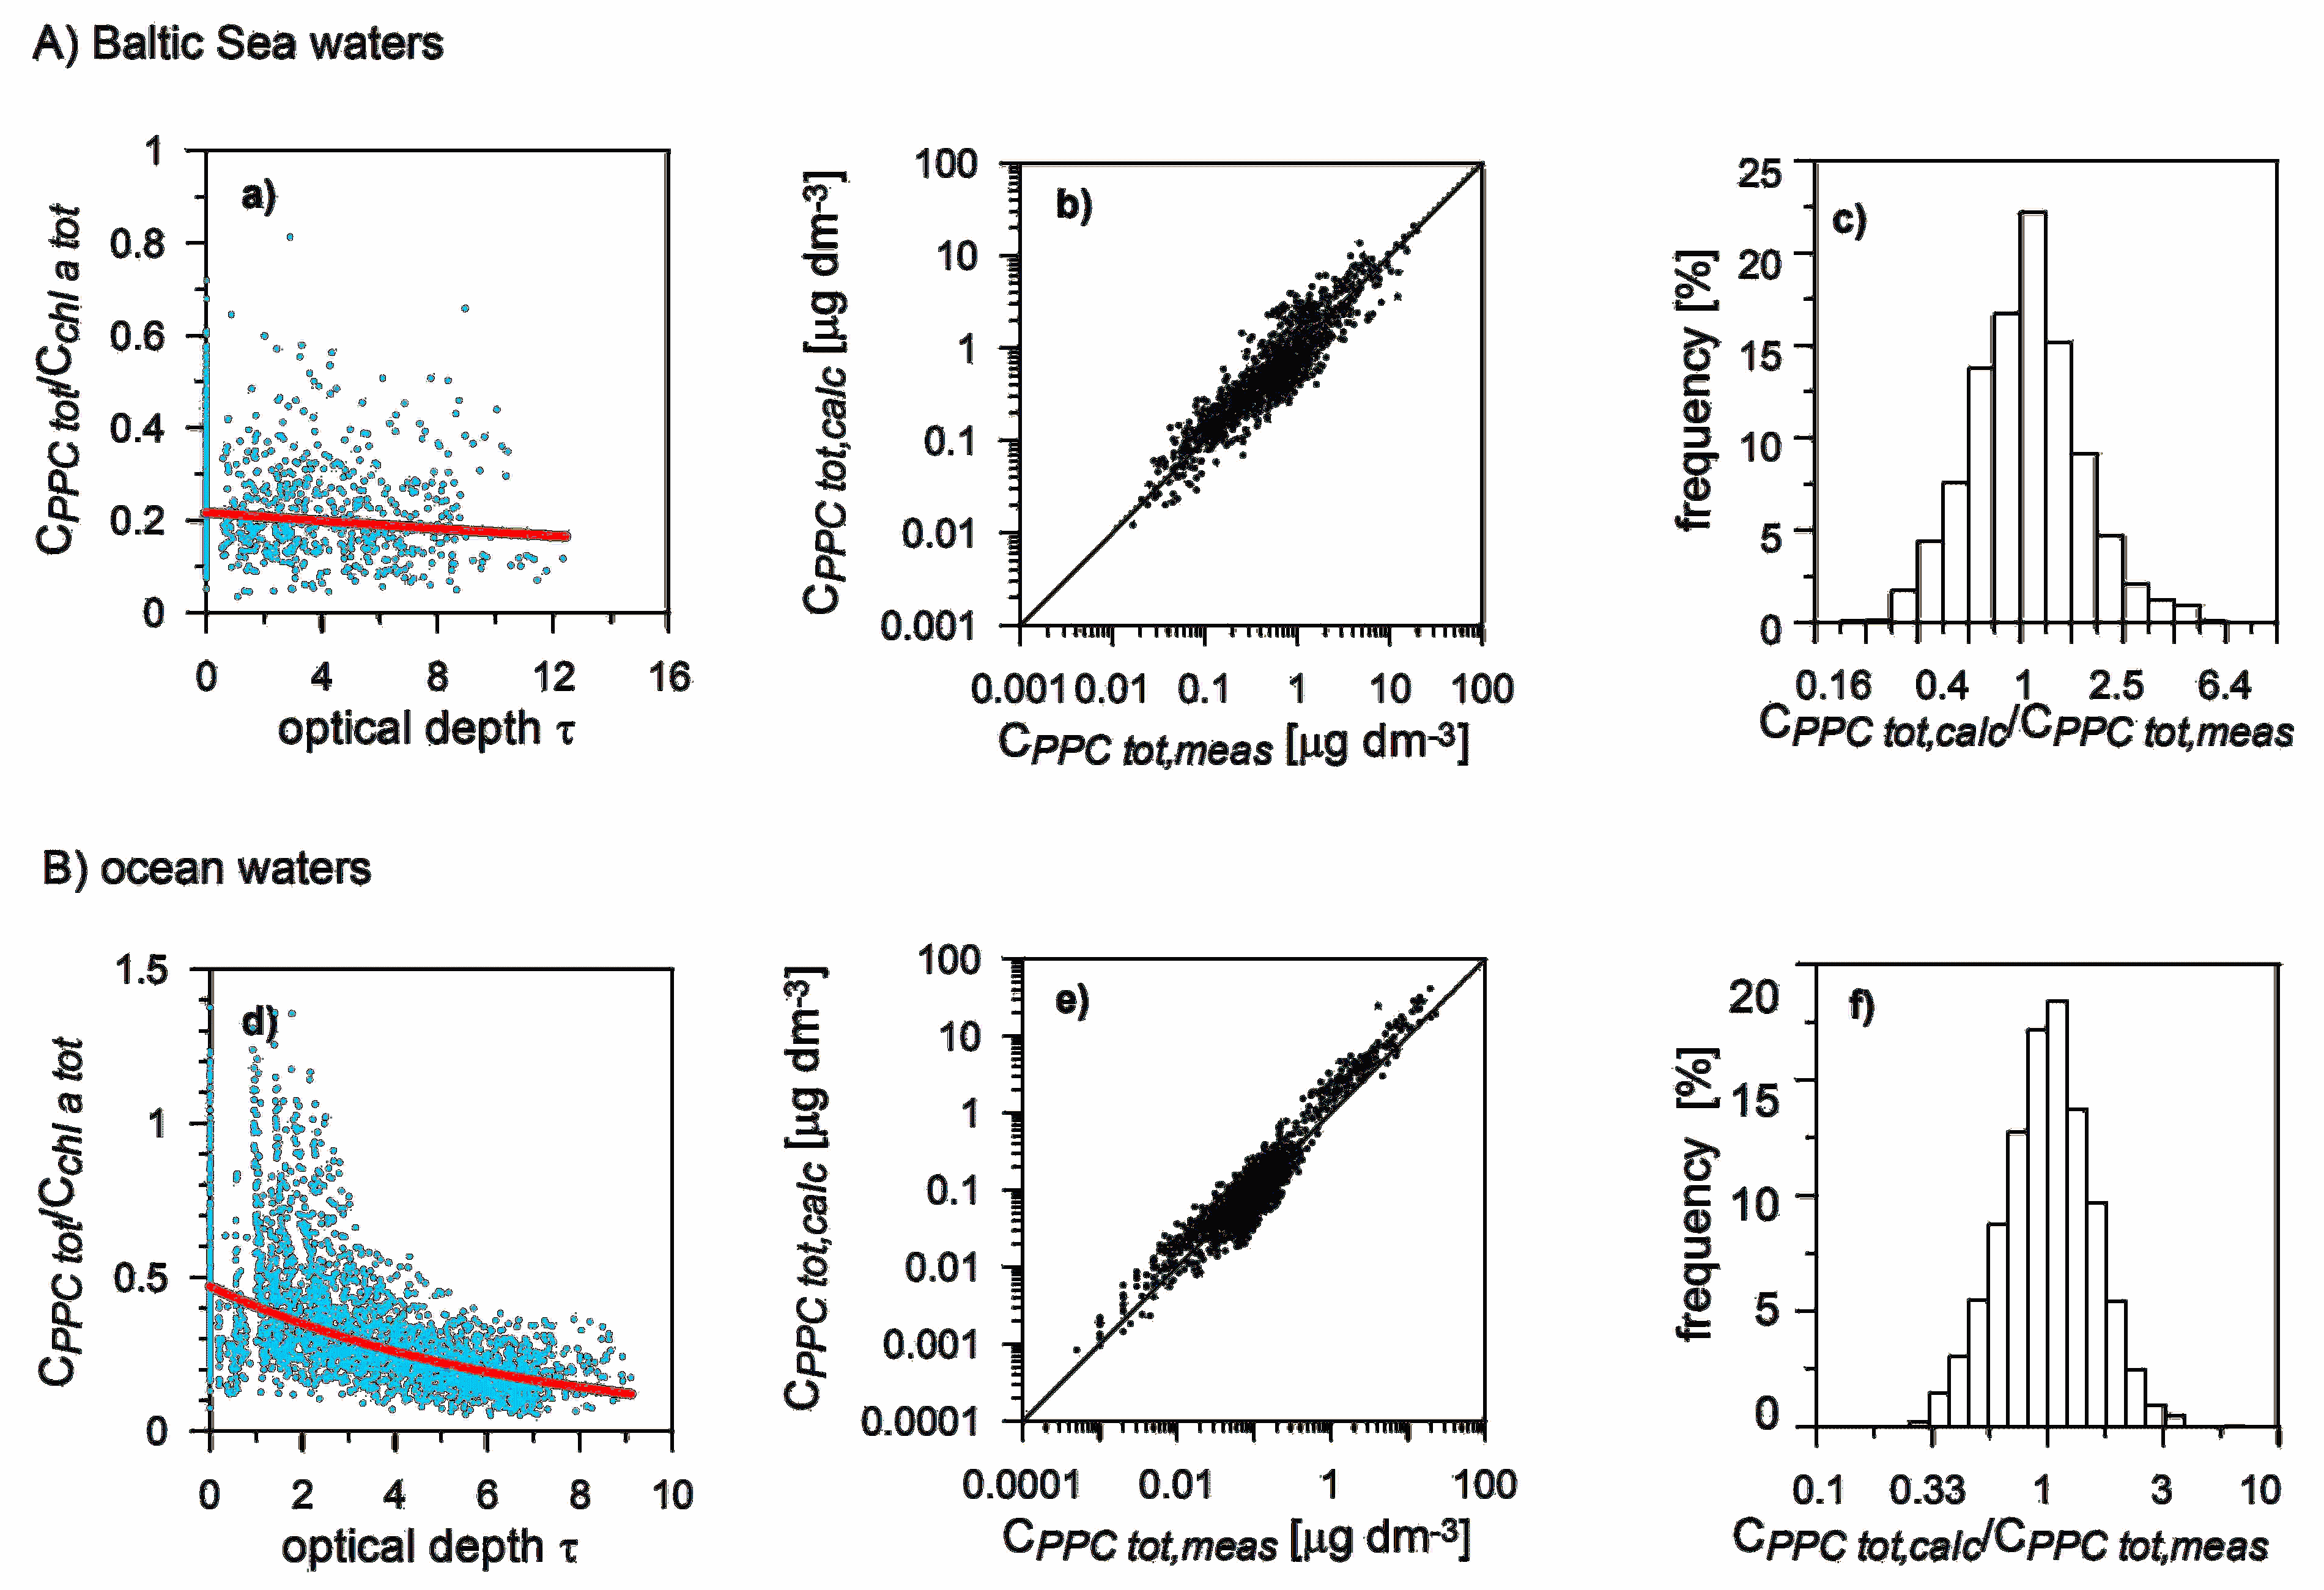 |
| Comparison of the statistical relationships between the relative concentrations of photoprotective carotenoids CPPC tot/Cchl a tot and the optical depth τ (dots – experimental data, line – approximation of equation (5 in the paper) obtained for Baltic waters (a) (the results obtained in this study) and ocean waters (d) (Majchrowski 2001); comparison of empirical data CPPC tot, measured and CPPC tot, calculated approximated with the relevant equation (b, e); histograms of the ratios CPPC tot, meas/CPPC tot, calc for Baltic and ocean data respectively (c, f) (from Stoń-Egiert et al., 2012, OCEANOLOGIA, 54 (1), pp. 7–27, Fig. 5; see more in the paper). |